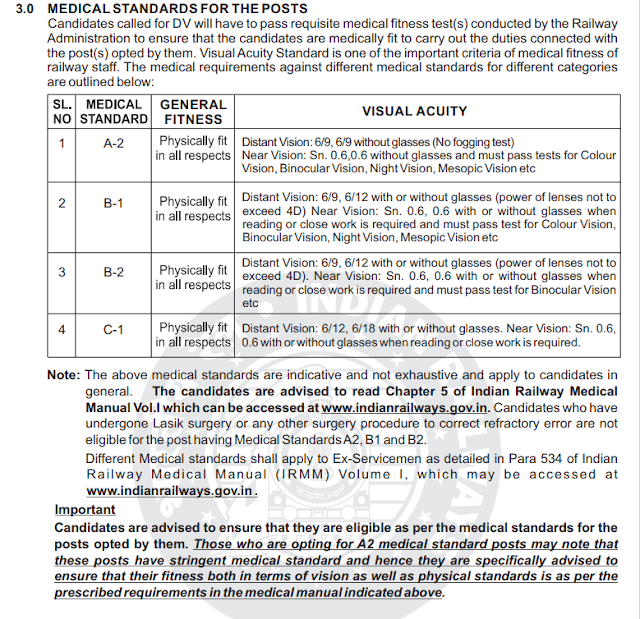
For the Benefit of Students/Candidates Applying online for the CEN-02/2018 Railway Recruitment Board Exams in 2018 , here is the Detail of Visual Acuity needed under Medical Standards for Qualification.
What is Visual Acuity ? And How it is Measured ?
As per the search online , We have quoting a result from Quora as follows :
Visual acuity (how sharply one sees objects) is tested with a chart with differently sized letters (or numbers) read from a distance (dependant on the size of the letters or numbers on the chart (Please refer Below an Example Chart) and is standardized for a given distance from which an individual reads off). This is called Snellen’s chart, named after a Dutch physician, Herman Snellen who came up with it in 1862 and used to this day to detect nearsightedness, far-sightedness and astigmatism. One would have seen this any eye specialist’s office, so I don't need to put one up here.
Someone who can read down to the eigth line of characters has optimal vision of 6/6. This is synonymous with 20/20 vision. 6 is used in the metric system for metres and the corresponding 20 is in feet. 6/6 or 20/20 does not mean perfect vision and does not determine peripheral vision, ability to identify colors, depth perception, etc.
Having 6/9 vision means you can see at 6 metres what a person with normal or optimal vision can see at 9 metres. This is equivalent to a visual acuity of 20/30 if the corresponding measures are in feet. Overall it means a mild loss of visual acuity - thats is, what you see from 6 metres is not as sharp as the other individual who can read the same line at 9 metres. Any decrease in visual acuity should be further investigated by an Ophthalmologist.
There is also a “tumbling E” chart for those who cannot read or are mute and can indicate the E with their middle three fingers in whichever direction the E is oriented. For children there are charts with the images of animals or familiar objects. Just like the standard chart noted up above, the size of the characters decrease from top to the bottom of the chart.


